DGX Spark at 64 Concurrent Requests: Throughput Is Not Latency
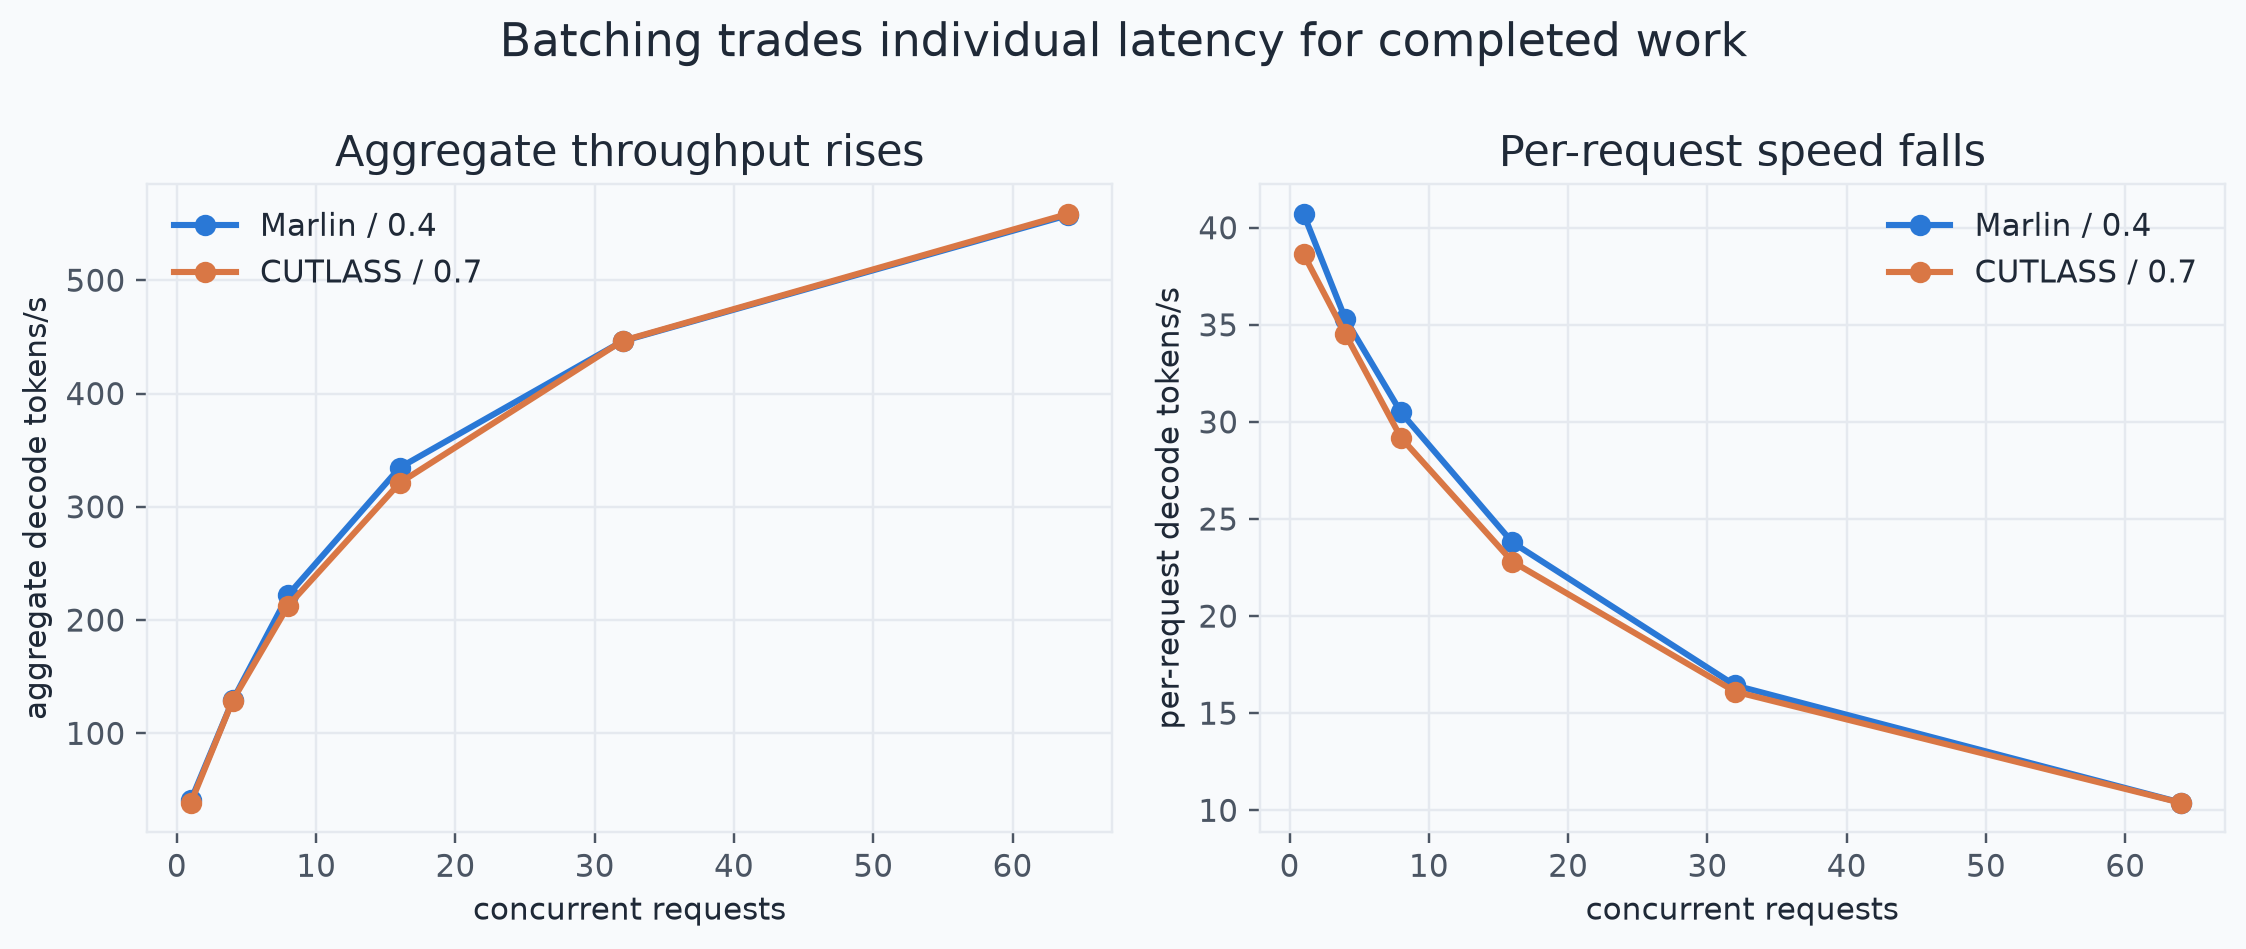
The DGX Spark served about 558 aggregate decode tokens per second at concurrency 64. It also slowed each request to about 10.4 tokens per second and pushed median time-to-first-token to roughly two seconds.
Both numbers are the benchmark.
Publishing only the aggregate result would make the box look like a throughput monster. Publishing only the per-request result would make batching look broken. The useful answer depends on which delay the workload can tolerate.
Two recipes, one saturation point
I ran Qwen3.6-35B-A3B-NVFP4 through a development build of vLLM at concurrency 1, 4, 8, 16, 32, and 64. Each point contains three runs.
The two recipes were:
- Marlin MoE backend with a 0.4 memory-utilization setting
- FlashInfer CUTLASS MoE backend with a 0.7 memory-utilization setting
They were practical recipes, not a controlled backend A/B. The memory setting changed. The runs were sequential. Starting memory conditions differed. I am not using the data to claim that one kernel is more memory-efficient than the other.
The endpoints were almost identical:
| Recipe | c1 aggregate | c64 aggregate | c1 per request | c64 per request | c64 median TTFT |
|---|---|---|---|---|---|
| Marlin / 0.4 | 40.7 tok/s | 557.5 tok/s | 40.7 tok/s | 10.4 tok/s | 2.05 s |
| CUTLASS / 0.7 | 38.6 tok/s | 558.6 tok/s | 38.6 tok/s | 10.4 tok/s | 1.92 s |
The public CSV includes every point, the engine version, model, request count, and recipe settings.
Aggregate throughput rose about fourteen-fold
The Marlin recipe moved from 40.715 aggregate decode tokens per second at c1 to 557.471 at c64. The CUTLASS recipe moved from 38.643 to 558.618.
That is the job the Spark earned in the acceptance trial. It is not my fastest single-stream local inference machine. It is the always-on CUDA node that can turn a queue into completed work.
Continuous batching keeps the accelerator occupied by scheduling work from multiple requests together. When one request cannot use every available execution slot, other requests fill the gaps. The platform does more total work even though no individual request gets the full machine.
That behavior matters for offline extraction, scheduled enrichment, background generation, evaluation, and agent workloads where dozens of tasks can wait together. It matters less for an interactive chat where one person is watching the first token.
The request paid for the gain
Per-request decode fell from roughly 40 tokens per second at c1 to 10.4 at c64. Median time-to-first-token rose from about 120 milliseconds to about two seconds.
That is not an implementation footnote. It is the price.
A throughput chart without a latency chart encourages the wrong capacity plan. It tells you how much work the box can finish but not what an individual user will feel. The reverse is also true: a single-stream benchmark can reject a machine that is excellent at clearing a batch queue.
The right concurrency ceiling comes from a written latency target:
- For a nightly queue, maximize accepted work per hour.
- For an internal tool, cap time-to-first-token and let aggregate throughput land where it lands.
- For a mixed service, reserve an interactive lane and send bulk work to a separate queue.
There is no honest “best concurrency” without the workload.
The backend result is less exciting than it looks
At c64, the recipes differed by 1.147 aggregate tokens per second. That is about two-tenths of one percent.
It is tempting to call that a tie or declare a winner based on the last decimal. Neither conclusion travels far. Three repetitions on one machine do not establish backend parity. Different memory settings prevent a clean attribution. Sequential runs leave room for thermal and memory-state effects.
The narrower result is more useful: these two recommended recipes reached the same practical saturation region under the tested request shape. I would choose between them on stability, supported models, launch behavior, and the latency budget—not on a one-token aggregate gap.
What this benchmark does not contain
There is no power measurement for these runs. There is no tokens-per-watt claim.
There is one quantized model, one development engine build, one unit, and one request shape. There is no reason to treat 558 tokens per second as a hardware ceiling. A different prompt length, output length, scheduler build, cache policy, or model can move the curve.
The trial also does not compare the Spark with a data-center GPU. That would answer a different buying question.
The reproducibility report keeps those limits beside the result. That is where they belong.
The capacity rule I kept
Measure three things at every concurrency point:
- aggregate completed work;
- per-request decode or time per output token; and
- time-to-first-token.
Then choose the operating point from the workload’s latency budget. Do not choose it from the tallest bar.
The Spark became more valuable when the queue got deeper. The request became less pleasant at the same time. That is not a contradiction. It is the scheduler doing exactly what batching asks it to do.
Get new posts by email — first
The newsletter is in the works — join the waitlist and be first to know when it launches. Everything here stays free to read.
The Solo Stack is written by Matt — building products solo with AI, on his own infrastructure. If a claim isn’t backed by experience or a measurement, it doesn’t ship.
Not sending yet: joining stores your address on the waitlist. One confirmation email at launch — nothing sends unless you confirm.